#!/bin/bash -xv
#
export PATH=/usr/lib64/qt-3.3/bin:/usr/local/bin:/bin:/usr/bin:/usr/local/sbin:/usr/sbin:/sbin:/home/oracle/bin:/home/oracle/bin::/mnt/mnt02/app/oracle/product/12.2.0.1/db_1/bin:/mnt/mnt02/app/oracle/product/12.2.0.1/db_1/OPatch
# To debug uncomment the below line
#set -x
#
# Set Environment Variables
#
TODAY="at $(date '+%H:%M on %d-%b-%y')"
OutputFilename=$(date +"%b_%d_%Y".html)
LastReport=/tmp/LastReport.txt
NowReport=/tmp/NowReport.txt
CurDate=`date +%D\ %T\ %Z`
#
# Set Alert Type according to Percentage
#
CriticalPercentage=90
WarningPercentage=85
NormalPercentage=70
#
# Get IP Address set from hosts file
#
IPADDRESS=`head -n 1 /etc/hosts | awk ' { print $1 }'`
#
# Remove Output File, if it already exists
#
if [ -f /tmp/${OutputFilename} ]; then
rm -f /tmp/${OutputFilename}
fi
if [ -f ${NowReport} ]; then
mv ${NowReport} ${LastReport}
cp /dev/null ${NowReport}
fi
#
# Find out Difference Previous and Current Report for each partition
#
df -Ph | grep -vE "^Filesystem|tmpfs|cdrom" | awk 'NR>0 && NF==6' | awk '{print $3}' > ${NowReport}
if [ -f ${LastReport} ]; then
DiffValue=(`awk '{ getline getdifference < "/tmp/LastReport.txt"; $1 -= getdifference; print }' /tmp/NowReport.txt`)
fi
#
# Defining HTML Table Format & Fields
#
(
echo '<HTML><HEAD><TITLE>Disk Usage Statistics</TITLE></HEAD>'
echo '<BODY>'
echo '<H3><font color="#5555E7" face="verdana" size="3">Disk Usage Report for server - '$(uname -n) for ${IPADDRESS}'</font></H3>'
echo '<P style="color:#5555E7" face="verdana" size="3">Report Generated '${TODAY}'</P>'
echo '<TABLE BORDER=1 CELLSPACING=0 CELLPADDING=2 bordercolor=#DEDEE2>'
echo '<style>
body {
font-family: verdana;
font: 16px verdana, sans-serif;
}
tbody th { text-align:right; background: #F8F8FA; color:red}
</style>'
# echo '<TR BGCOLOR=\"#BBFFFF\"> <TH><font color="#5555E7"><font face="verdana"><b>Filesystem</b></font></TH> <TH>Total</TH> <TH>Disk Used</TH>
#<TH>Available</TH> <TH>Percentage Info</TH> <TH>Mounted On</TH> <TH>Critical Alert</TH>
#<TH>Report Date</TH> <TH>12 Hrs Difference </TH><//TR>'
echo '<TR BGCOLOR=\"#4863A0\"> <TH><font color="#5555E7" face="verdana" size="2"><b>Filesystem</b></font></TH> <TH><font color="#5555E7" face="verdana" size="2"><b>Total</b></font></TH> <TH><font color="#5555E7" face="verdana" size="2"><b>Disk Used</b></font></TH><TH><font color="#5555E7" size="2" face="verdana"><b>Available</b></font></TH> <TH><font color="#5555E7" size="2" face="verdana"><b>Percentage Info</b></font></TH> <TH><font color="#5555E7" size="2" face="verdana"><b>Mounted On</b></font></TH> <TH><font color="#5555E7" size="2" face="verdana"><b>Critical Alert</b></font></TH></TR>'
#
# Extract Disk Usage Information
# Suppress Listing of “FileSystem, tmpfs and cdrom” Information
#
ArryCount=0
df -Ph | grep -vE "^Filesystem|tmpfs|cdrom" | awk 'NR>0 && NF==6'|sort|while read FileSystem Size DiskUsed DiskFree DiskPercentUsed MountPoint
do
PERCENT=${DiskPercentUsed%%%}
#
# Calculate the Difference between previous run and current run
#
TDiffValue=(`awk '{ getline getdifference < "/tmp/LastReport.txt"; $1 -= getdifference; print }' /tmp/NowReport.txt`)
#
# Verify if disk usage is greater equal to than set threshold limit - 90%
#
if [[ ${PERCENT} -ge ${CriticalPercentage} ]];
then
COLOR=red
CRITICALALERT="Yes, Notify"
elif [ ${PERCENT} -ge ${WarningPercentage} ] && [ ${PERCENT} -le 90 ];
then
COLOR=orange
CRITICALALERT=No
else
COLOR=green
CRITICALALERT=NA
fi
echo '<TR><TD>'$FileSystem'</TD><TD ALIGN=RIGHT>'$Size'</TD>'
echo '<TD ALIGN=RIGHT>'$DiskUsed'</TD><TD ALIGN=RIGHT>'$DiskFree'</TD>'
echo '<TD><TABLE BORDER=0 CELLSPACING=3 CELLPADDING=0>'
echo '<TR><TD WIDTH='$((2 * $PERCENT))' BGCOLOR="'$COLOR'"></TD>'
echo '<TD WIDTH='$((2 * (100 - $PERCENT)))' BGCOLOR="gray"></TD>'
echo '<TD><FONT FONT-WEIGHT="bold" SIZE=-1
COLOR="'$COLOR'">'$DiskPercentUsed'</FONT></TD>'
echo '<TR></TABLE><TD>'$MountPoint'</TD>'
echo '<TD><FONT font-weight="bold">'$CRITICALALERT'</TD></FONT>'
# echo '<TD><FONT font-weight="bold">'`date`'</TD></FONT>'
3 echo '<TD><FONT font-weight="bold">'${TDiffValue[ArryCount]} \(in bytes\)'</TD></FONT></TR>'
echo $DiskUsed >> `hostname`.usage.txt
ArryCount=$ArryCount+1
done
echo '</TABLE>'
echo '</P><BR>'
echo '<TABLE BORDER=1 CELLSPACING=3 CELLPADDING=0>'
echo '<TR><TH FONT font-weight="bold">Legend Information</TH></TR>'
echo '<TR><TD FONT color="white" BGCOLOR="RED">Critical Alert</TD></TR>'
echo '<TR><TD FONT color="white" BGCOLOR="ORANGE">Warning Alert</TD></TR>'
echo '<TR><TD FONT color="white" BGCOLOR="GREEN">No Action Alert</TD></TR>'
echo '</TABLE>'
echo '<BODY></HTML>'
echo '<P><FONT font-weight="bold">Report Generated by DBA Team</P>'
) | tee `hostname`_${0##*/}.html
#
# Sending E-Mail Notification
#
(
echo To: "#DL-OracleSYSDBA@XXXX.com"
echo From: oracle@XXXXX.localdomain
echo "Content-Type: text/html; "
echo Subject: Disk Usage Report for server `hostname` 'for' $IPADDRESS
echo
cat `hostname`_${0##*/}.html
) | sendmail -t
echo -e "Report Generation is Completed... \n\a"
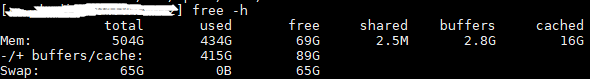
Sample Output

#
export PATH=/usr/lib64/qt-3.3/bin:/usr/local/bin:/bin:/usr/bin:/usr/local/sbin:/usr/sbin:/sbin:/home/oracle/bin:/home/oracle/bin::/mnt/mnt02/app/oracle/product/12.2.0.1/db_1/bin:/mnt/mnt02/app/oracle/product/12.2.0.1/db_1/OPatch
# To debug uncomment the below line
#set -x
#
# Set Environment Variables
#
TODAY="at $(date '+%H:%M on %d-%b-%y')"
OutputFilename=$(date +"%b_%d_%Y".html)
LastReport=/tmp/LastReport.txt
NowReport=/tmp/NowReport.txt
CurDate=`date +%D\ %T\ %Z`
#
# Set Alert Type according to Percentage
#
CriticalPercentage=90
WarningPercentage=85
NormalPercentage=70
#
# Get IP Address set from hosts file
#
IPADDRESS=`head -n 1 /etc/hosts | awk ' { print $1 }'`
#
# Remove Output File, if it already exists
#
if [ -f /tmp/${OutputFilename} ]; then
rm -f /tmp/${OutputFilename}
fi
if [ -f ${NowReport} ]; then
mv ${NowReport} ${LastReport}
cp /dev/null ${NowReport}
fi
#
# Find out Difference Previous and Current Report for each partition
#
df -Ph | grep -vE "^Filesystem|tmpfs|cdrom" | awk 'NR>0 && NF==6' | awk '{print $3}' > ${NowReport}
if [ -f ${LastReport} ]; then
DiffValue=(`awk '{ getline getdifference < "/tmp/LastReport.txt"; $1 -= getdifference; print }' /tmp/NowReport.txt`)
fi
#
# Defining HTML Table Format & Fields
#
(
echo '<HTML><HEAD><TITLE>Disk Usage Statistics</TITLE></HEAD>'
echo '<BODY>'
echo '<H3><font color="#5555E7" face="verdana" size="3">Disk Usage Report for server - '$(uname -n) for ${IPADDRESS}'</font></H3>'
echo '<P style="color:#5555E7" face="verdana" size="3">Report Generated '${TODAY}'</P>'
echo '<TABLE BORDER=1 CELLSPACING=0 CELLPADDING=2 bordercolor=#DEDEE2>'
echo '<style>
body {
font-family: verdana;
font: 16px verdana, sans-serif;
}
tbody th { text-align:right; background: #F8F8FA; color:red}
</style>'
# echo '<TR BGCOLOR=\"#BBFFFF\"> <TH><font color="#5555E7"><font face="verdana"><b>Filesystem</b></font></TH> <TH>Total</TH> <TH>Disk Used</TH>
#<TH>Available</TH> <TH>Percentage Info</TH> <TH>Mounted On</TH> <TH>Critical Alert</TH>
#<TH>Report Date</TH> <TH>12 Hrs Difference </TH><//TR>'
echo '<TR BGCOLOR=\"#4863A0\"> <TH><font color="#5555E7" face="verdana" size="2"><b>Filesystem</b></font></TH> <TH><font color="#5555E7" face="verdana" size="2"><b>Total</b></font></TH> <TH><font color="#5555E7" face="verdana" size="2"><b>Disk Used</b></font></TH><TH><font color="#5555E7" size="2" face="verdana"><b>Available</b></font></TH> <TH><font color="#5555E7" size="2" face="verdana"><b>Percentage Info</b></font></TH> <TH><font color="#5555E7" size="2" face="verdana"><b>Mounted On</b></font></TH> <TH><font color="#5555E7" size="2" face="verdana"><b>Critical Alert</b></font></TH></TR>'
#
# Extract Disk Usage Information
# Suppress Listing of “FileSystem, tmpfs and cdrom” Information
#
ArryCount=0
df -Ph | grep -vE "^Filesystem|tmpfs|cdrom" | awk 'NR>0 && NF==6'|sort|while read FileSystem Size DiskUsed DiskFree DiskPercentUsed MountPoint
do
PERCENT=${DiskPercentUsed%%%}
#
# Calculate the Difference between previous run and current run
#
TDiffValue=(`awk '{ getline getdifference < "/tmp/LastReport.txt"; $1 -= getdifference; print }' /tmp/NowReport.txt`)
#
# Verify if disk usage is greater equal to than set threshold limit - 90%
#
if [[ ${PERCENT} -ge ${CriticalPercentage} ]];
then
COLOR=red
CRITICALALERT="Yes, Notify"
elif [ ${PERCENT} -ge ${WarningPercentage} ] && [ ${PERCENT} -le 90 ];
then
COLOR=orange
CRITICALALERT=No
else
COLOR=green
CRITICALALERT=NA
fi
echo '<TR><TD>'$FileSystem'</TD><TD ALIGN=RIGHT>'$Size'</TD>'
echo '<TD ALIGN=RIGHT>'$DiskUsed'</TD><TD ALIGN=RIGHT>'$DiskFree'</TD>'
echo '<TD><TABLE BORDER=0 CELLSPACING=3 CELLPADDING=0>'
echo '<TR><TD WIDTH='$((2 * $PERCENT))' BGCOLOR="'$COLOR'"></TD>'
echo '<TD WIDTH='$((2 * (100 - $PERCENT)))' BGCOLOR="gray"></TD>'
echo '<TD><FONT FONT-WEIGHT="bold" SIZE=-1
COLOR="'$COLOR'">'$DiskPercentUsed'</FONT></TD>'
echo '<TR></TABLE><TD>'$MountPoint'</TD>'
echo '<TD><FONT font-weight="bold">'$CRITICALALERT'</TD></FONT>'
# echo '<TD><FONT font-weight="bold">'`date`'</TD></FONT>'
3 echo '<TD><FONT font-weight="bold">'${TDiffValue[ArryCount]} \(in bytes\)'</TD></FONT></TR>'
echo $DiskUsed >> `hostname`.usage.txt
ArryCount=$ArryCount+1
done
echo '</TABLE>'
echo '</P><BR>'
echo '<TABLE BORDER=1 CELLSPACING=3 CELLPADDING=0>'
echo '<TR><TH FONT font-weight="bold">Legend Information</TH></TR>'
echo '<TR><TD FONT color="white" BGCOLOR="RED">Critical Alert</TD></TR>'
echo '<TR><TD FONT color="white" BGCOLOR="ORANGE">Warning Alert</TD></TR>'
echo '<TR><TD FONT color="white" BGCOLOR="GREEN">No Action Alert</TD></TR>'
echo '</TABLE>'
echo '<BODY></HTML>'
echo '<P><FONT font-weight="bold">Report Generated by DBA Team</P>'
) | tee `hostname`_${0##*/}.html
#
# Sending E-Mail Notification
#
(
echo To: "#DL-OracleSYSDBA@XXXX.com"
echo From: oracle@XXXXX.localdomain
echo "Content-Type: text/html; "
echo Subject: Disk Usage Report for server `hostname` 'for' $IPADDRESS
echo
cat `hostname`_${0##*/}.html
) | sendmail -t
echo -e "Report Generation is Completed... \n\a"
Sample Output